OEE says 66%. But is the machine the problem?
A number on its own does not tell you where to act. GI4 breaks efficiency down into times, states and causes, batch by batch, and shows you where to look.
Let's talk about your plant
The questions on this page
- “The batch OEE is 66%: is the machine underperforming?”An OEE that tells you where to look
- “What did this machine do yesterday?”Producing, paused, stopped: three colours, three responsibilities
- “Of the last few batches, which one went worst?”From the batch list to a single batch, in one click
- “The line stopped for 40 minutes. Why?”Downtime causes, assigned in a few clicks
- “The target was set by the person judged on the result.”An honest OEE, even when it isn’t flattering
The problem
“The batch OEE is 66%: is the machine underperforming?”
An OEE that tells you where to look
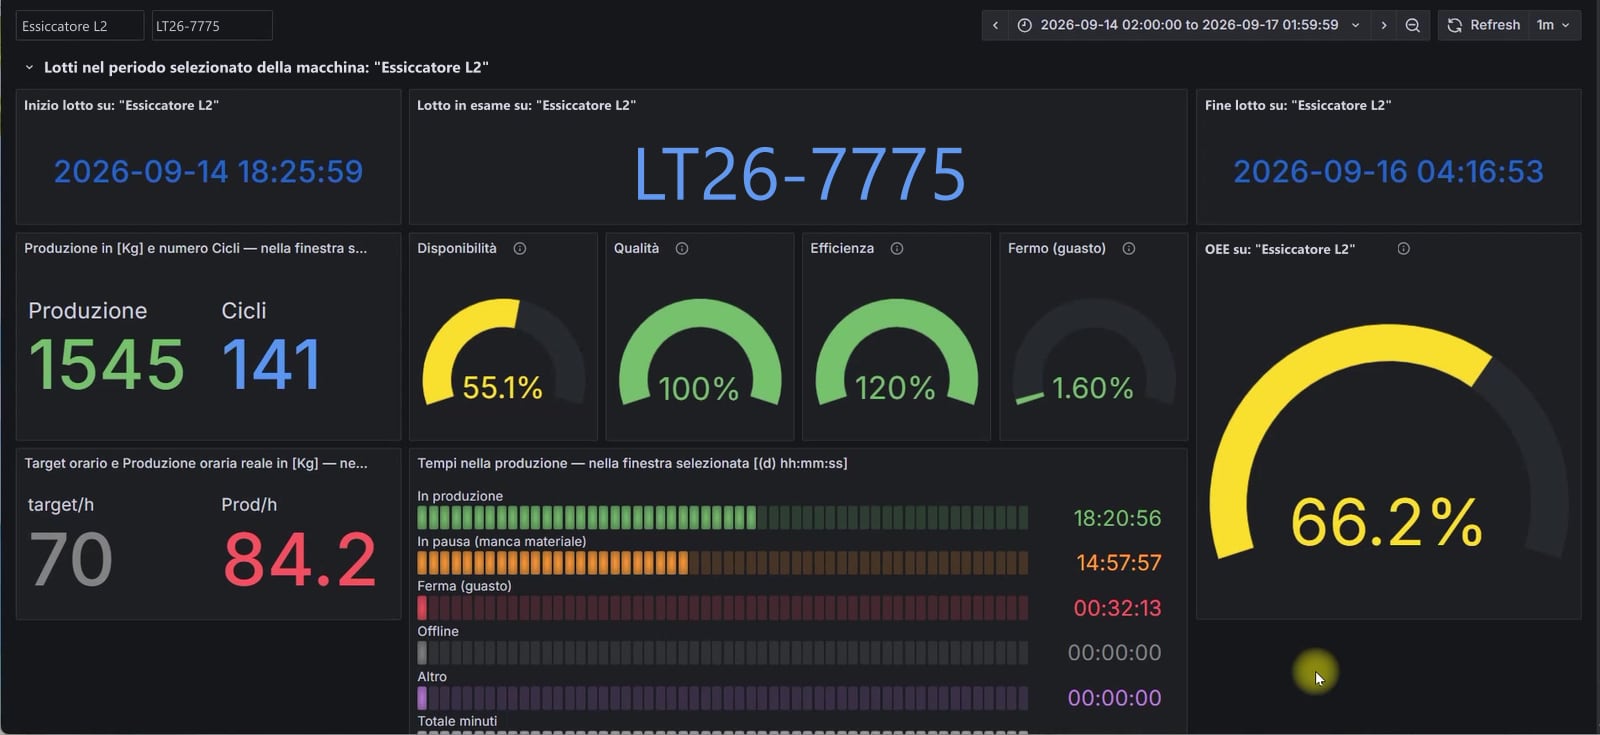
A real case: a dryer and a batch that ran for three days. Availability 55.1%, quality 100%, performance 120%, breakdown time 1.6%. Target 70 kg/h, actual output 84.2 kg/h. OEE: 66.2%.
The batch view puts the times side by side: 18 hours 20 minutes producing, almost 15 hours paused for lack of material, half an hour stopped by a fault.
The machine ran 20% faster than planned, with no rejects. OEE is at two thirds because it was waiting for material from upstream. An OEE figure on its own says “66%”; this view tells you where to look — and it isn’t the machine.
The problem
“What did this machine do yesterday?”
Producing, paused, stopped: three colours, three responsibilities
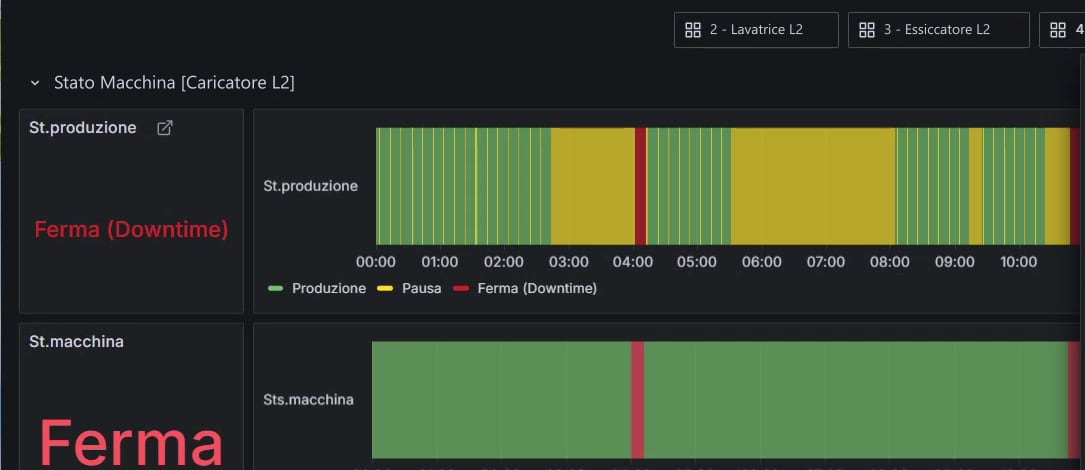
A timeline shows how time was split between production, pause and stop, with the percentage breakdown and the batches that ran. Narrow the selection and the whole page recalculates for the new interval.
The colours carry a distinction that matters: green is producing, yellow is paused, red is stopped by a fault. A pause is typically material not arriving from upstream: a line problem, not a machine problem. A dashboard that lumped them together as “machine stopped” would blame the machine for something it didn’t do.
You can also see micro-stops: a quick clean, a jam — the things nobody remembers at the end of the shift.
The problem
“Of the last few batches, which one went worst?”
From the batch list to a single batch, in one click
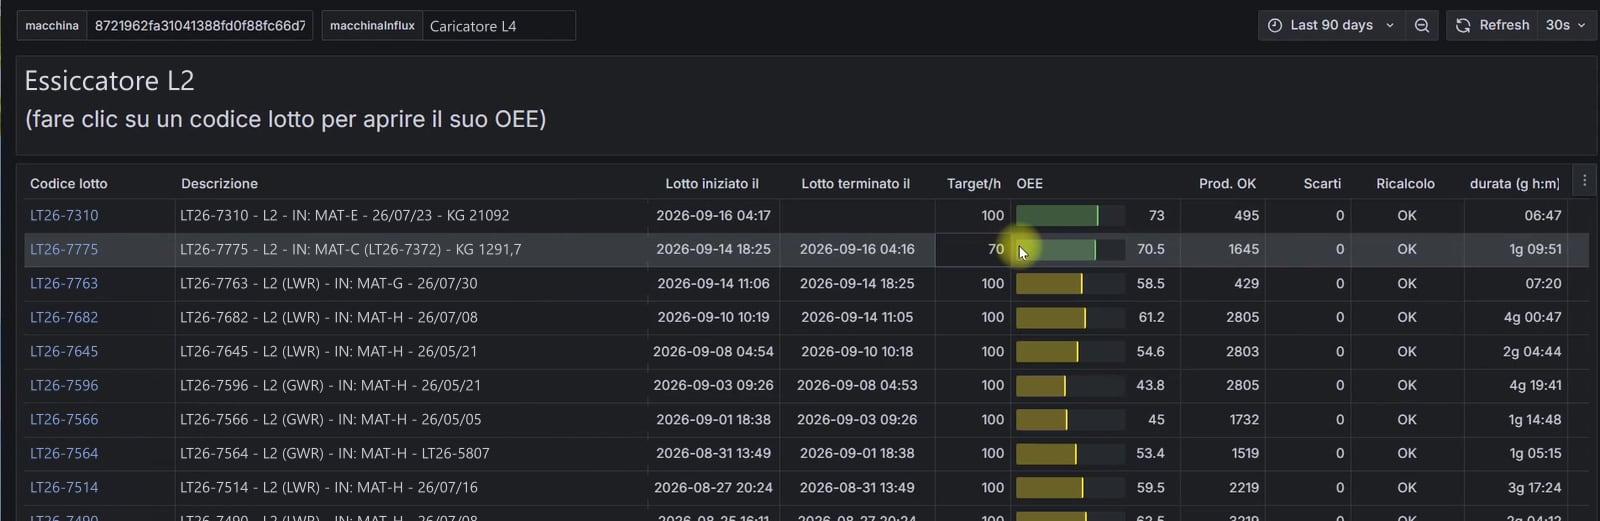
One page lists a machine’s batches with their OEE, quantities, rejects and duration. Every batch code is clickable: it opens that batch’s OEE, with the time window already set to its duration.
OEE can be read by batch, machine, day, week, month and shift: the night shift isn’t judged by the morning’s yardstick.
The problem
“The line stopped for 40 minutes. Why?”
Downtime causes, assigned in a few clicks
Without the cause, OEE tells you how much you lose. With the cause, it tells you where to act: “40 minutes for a format change, and it happened 12 times this month”.
Each machine has its own list of causes, not a universal list that pushes everyone to pick “Other”. Operators assign the cause from a simplified screen on the panel, in a few clicks; where needed, restart waits until a cause has been assigned — a choice made machine by machine.
Analysis happens in MIO: an exportable table with one row per stop and the percentage breakdown of causes.
The data is only as good as the discipline with which it is entered. That is why few clicks and short lists are not usability details: they are what makes the data exist at all.

The problem
“The target was set by the person judged on the result.”
An honest OEE, even when it isn’t flattering
GI4 calculates OEE as availability × performance × quality, and does it in minutes: every piece becomes the time it should have taken at nominal rate. Minutes always add up — across products, units and machines — and averaged percentages don’t distort the result.
An OEE above 100% is not capped: it is the system telling you the target is wrong. The bar stops at 100%; the real value stays visible.
Breakdown time has its own indicator, next to OEE: the two are read together. And where rejects can’t be measured, we say so, rather than showing a 100% quality nobody measured.

At a glance
- OEE by batch, machine, day, week, month and shift
- Machine states over time, micro-stops included
- Downtime causes assigned by operators, per machine
- Hourly target versus actual output
- Breakdown time measured separately, alongside OEE
Other topics
 Recipes and parameters Automatic versions, comparisons, readable parameters.
 Batches and traceability Who changed what, when, in which batch.
 MIO: dashboards and analysis Cross-referenced charts, per-piece quality, energy use.
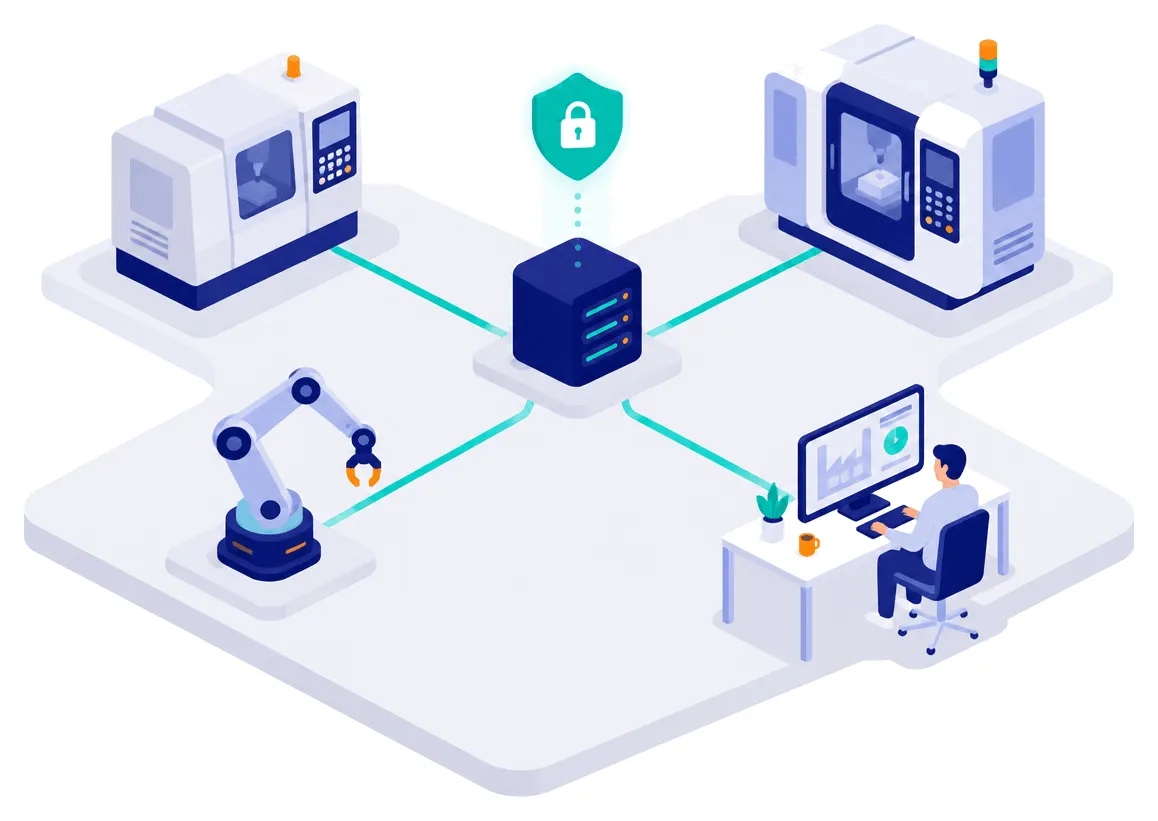 Connecting machines and systems Machines of any age, MES and ERP, data kept in-house.
 Operators and access Personal keys, permissions, the shop floor at the centre.
How open is your machine?
It is the question that decides the time and cost of every GI4 installation. We look for the answer together, on your plant, before any quote.
- 8plants in operation
- 4industries
- 28machines connected in the largest installation, across 11 lines