The data is there. Who makes it talk?
MIO is GI4’s environment for dashboards and analysis: states, OEE, energy use, alarms, per-piece quality. Included in GI4, built on Grafana, designed around your plant.
Let's talk about your plant
The questions on this page
- “The speed dropped to zero: is it a fault?”The cross-referenced chart explains why
- “How are the lines doing right now?”The whole plant at a glance
- “We have 11,594 rejects: where do they come from?”Good and rejected parts, test by test
- “I need the data for every piece, in Excel.”Per-piece data, exportable
- “For Transizione 5.0 I need to measure energy use before and after.”Energy and consumption, machine by machine
- “And who maintains these dashboards in five years’ time?”Open technology, not a black box
The problem
“The speed dropped to zero: is it a fault?”
The cross-referenced chart explains why
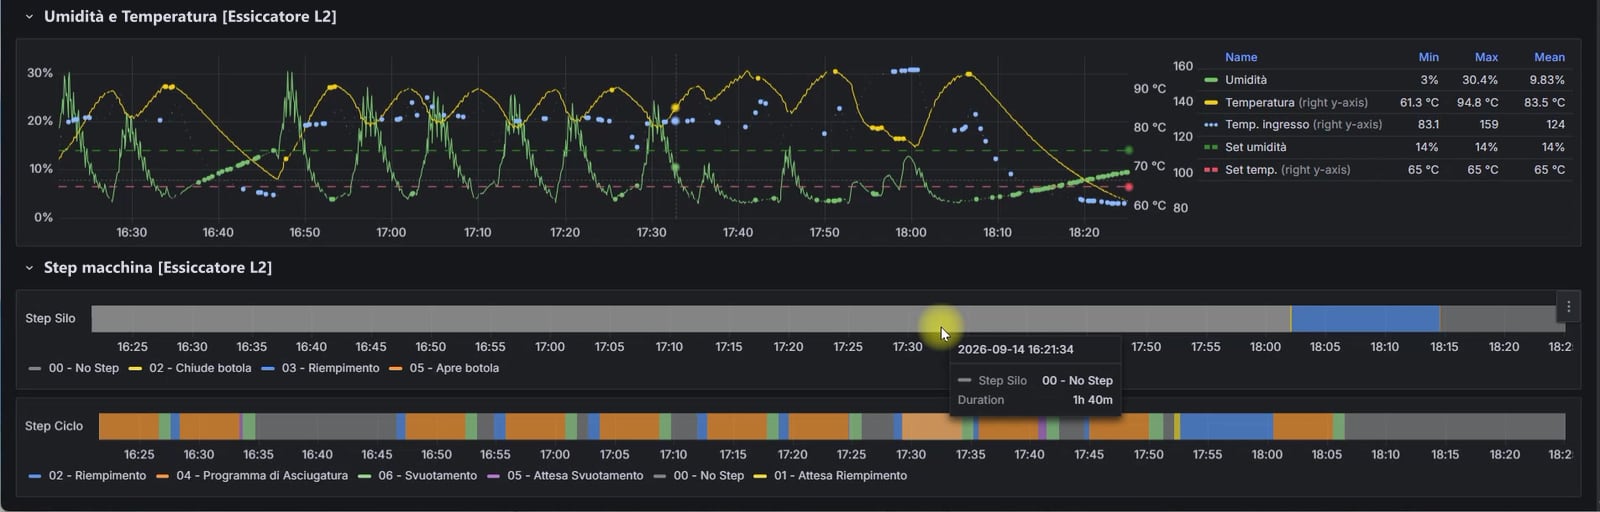
On the same time axis, three layers: the settings, the actual measurements and the steps the machine was running. The insight isn’t in any of the three on its own.
An example from GEM’s documentation: the ventilation setpoint stayed at 2.8 m/s, but the actual speed had dropped to zero, because fan power had gone from 68% to 20%. The machine was unloading material. No alarm, no anomaly: just behaviour that, without the cross-referenced chart, would have looked like a fault.
The problem
“How are the lines doing right now?”
The whole plant at a glance
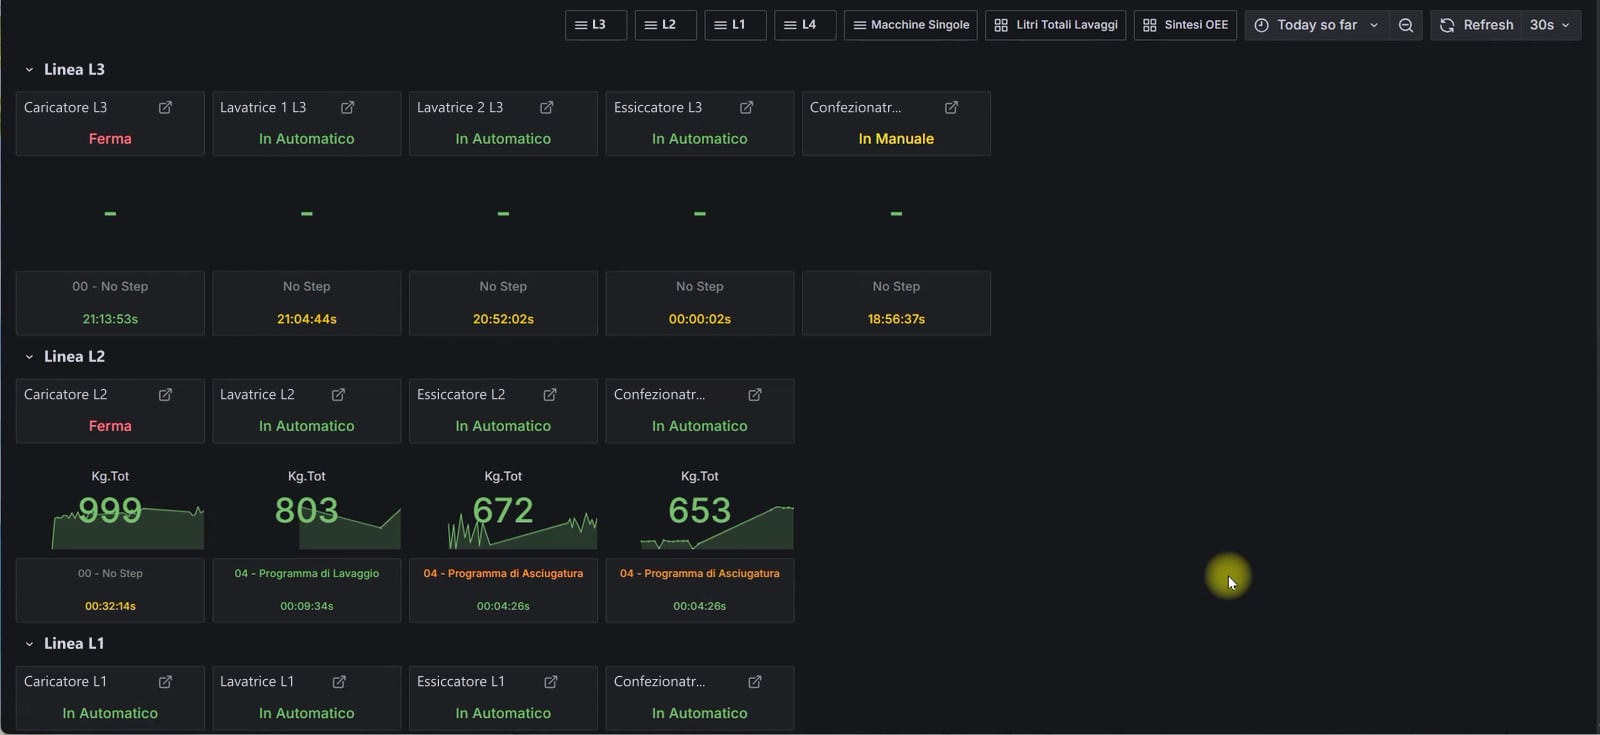
The home page is designed around each plant: the lines with their machines, the state of each — stopped, automatic, manual — output, and quick access to the detail.
You start from standard screens that suit most machines, and add custom pages for what a specific line or machine needs. Light and dark theme.
The problem
“We have 11,594 rejects: where do they come from?”
Good and rejected parts, test by test
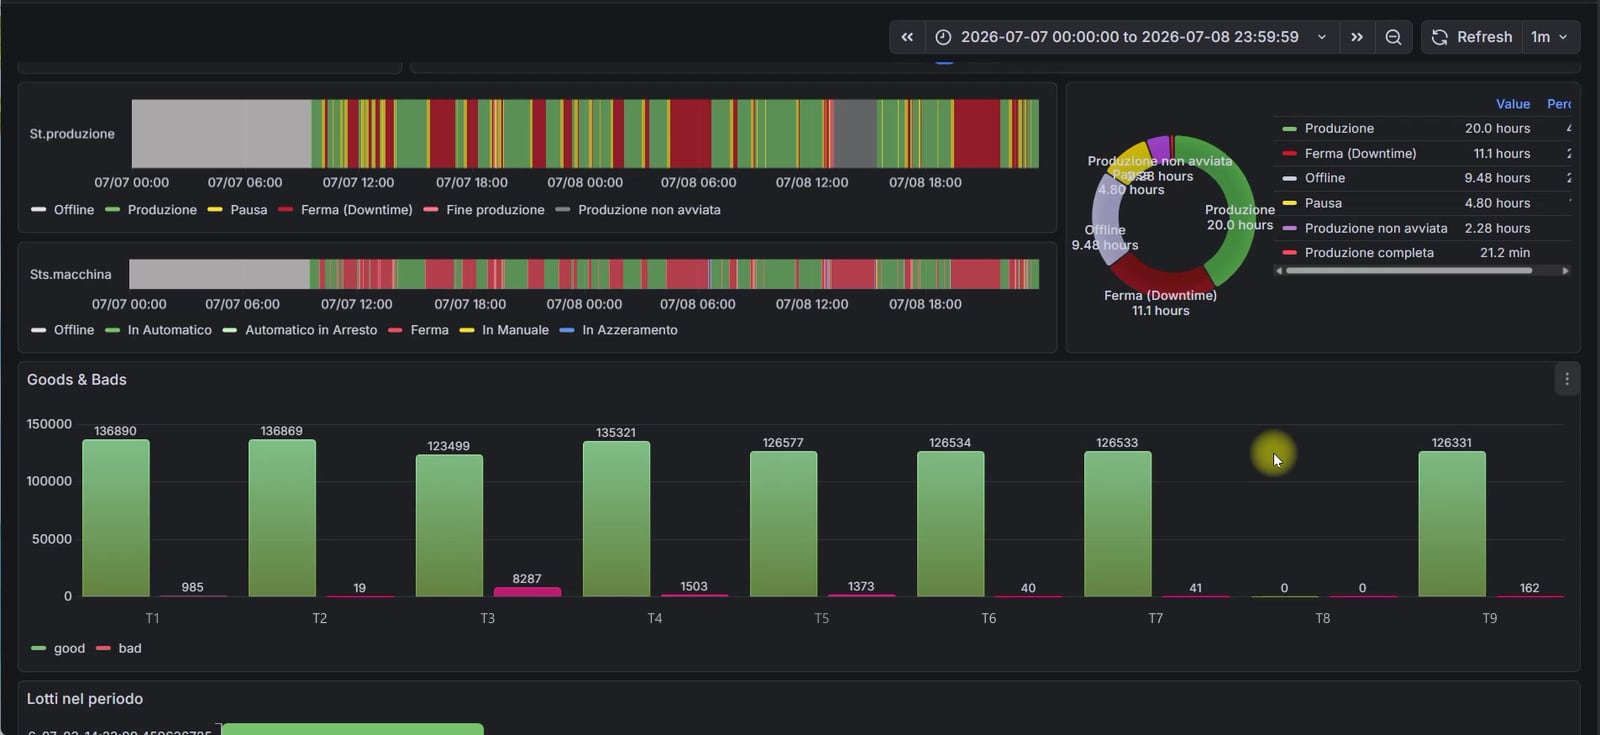
A histogram with one bar per test, good and rejected parts separately. A real case, two days on a test bench running nine tests: 126,290 good parts and 11,594 rejects. The total says “8% rejects”. The chart says a single test produces 8,287 of them: 71% of the problem.
With nine tests across four stations, that is the difference between an investigation and a fix. And a test that isn’t running shows up: zero good, zero rejected. Whether it was switched off on purpose or stopped by a problem is for someone who knows the machine to check.
The problem
“I need the data for every piece, in Excel.”
Per-piece data, exportable
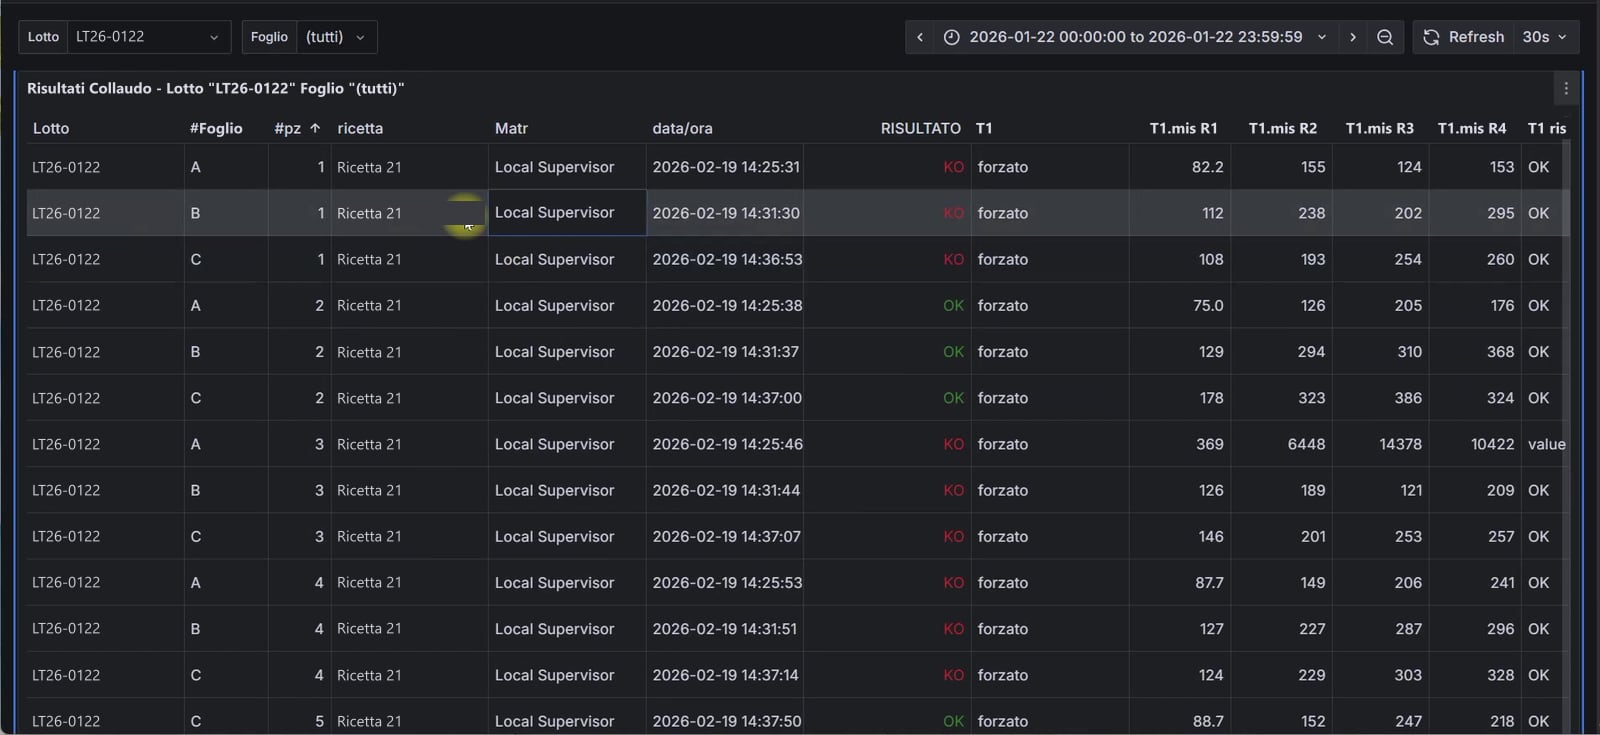
On machines that capture data every cycle, GI4 records one row per piece: OK or NOK result, whether the test was forced, measurements, limits and tolerance. On a sheet of parts, also the sheet and the piece’s position.
MIO puts it in a table you can export to CSV, print, and open in Excel. For measuring machines it also shows each test’s trend over time, with minimum, maximum and actual measurement: charts share a common crosshair, so you can see when this jumped, what that was doing.
The problem
“For Transizione 5.0 I need to measure energy use before and after.”
Energy and consumption, machine by machine
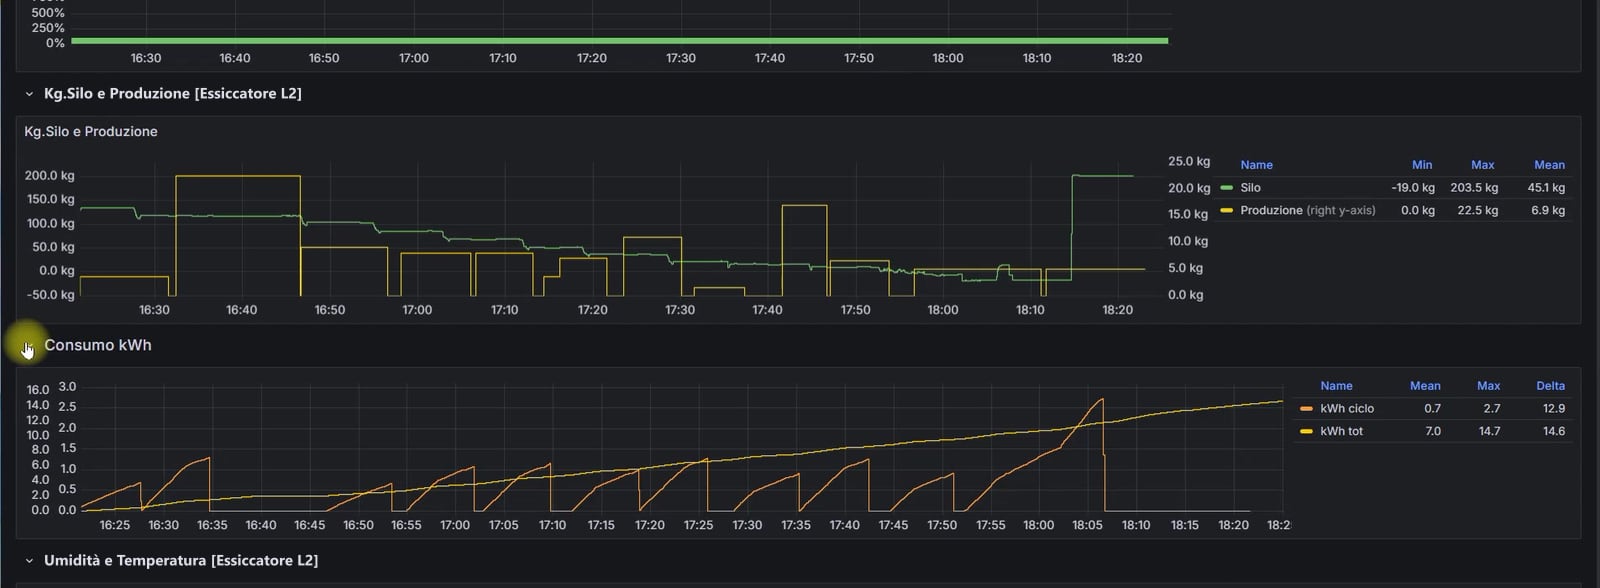
GI4 measures kW and kWh on every connected machine, per cycle and over time, together with other process consumption where it is measured: water, air, chemicals. And it keeps the history.
Italy’s Transizione 5.0 incentive requires measuring before and after an efficiency upgrade: GI4 is the measuring tool. Tax matters stay with the company’s adviser.
Crossing consumption with recipes answers questions worth money: which recipe uses the most water per kilo produced? Did the new rinse really cut the litres?
The problem
“And who maintains these dashboards in five years’ time?”
Open technology, not a black box
MIO is Grafana, with dashboards developed by GEM and a customised look. Not a proprietary platform: mature, open-source technology that the company can learn, extend and, if it wishes, maintain itself.
That is also where its connectivity comes from: beyond GI4’s databases, MIO can connect to data sources the company already has. No need to take our word for it: it’s Grafana’s catalogue, open for anyone to check.
Alongside the dashboards, alarms: those active right now, and statistics by code and distribution over time.

At a glance
- Home page designed around the plant, standard and custom screens
- Charts crossing settings, measurements and machine steps
- Good and rejected parts per test, test trends
- Per-piece data exportable to CSV
- kW, kWh and process consumption per machine
- Active alarms and statistics
Other topics
 OEE and downtime Where production is really lost: times, states, causes.
 Recipes and parameters Automatic versions, comparisons, readable parameters.
 Batches and traceability Who changed what, when, in which batch.
 Connecting machines and systems Machines of any age, MES and ERP, data kept in-house.
 Operators and access Personal keys, permissions, the shop floor at the centre.
How open is your machine?
It is the question that decides the time and cost of every GI4 installation. We look for the answer together, on your plant, before any quote.
- 8plants in operation
- 4industries
- 28machines connected in the largest installation, across 11 lines